Overview
In an effort to increase value-based outcomes for members and compete in a growing and competitive healthcare market, a Fortune 500 Healthcare company sought to modernize its data infrastructures by employing Human-Centered Design (HCD) and Agile methodologies. For this particular initiative, we led multi-disciplinary teams through design thinking methods in order to determine the data needs of case managers and how the systems would support their needs.
Desired Outcomes
Ingestion of timely data will enable case managers to access information more efficiently and ultimately:
Reduce untimely interventions and missed opportunities for continued care that occur with time and resources spent searching for and gathering data from multiple sources
Reduce costs associated with having to track down relevant data
Increase timely outreach and quality of care for members to prevent readmissions and increased healthcare costs
Problem
Case managers don’t have the right data at the right time in order to effectively outreach to members. This results in fewer outreaches and a higher chance of readmissions, leading to a decrease in quality of care and increased costs.
Design Challenge
How might we improve the ability of case managers to effectively outreach to members in a timely manner?
Role
My role as Design Lead on a two-person team was to partner up as User Researcher, Designer, and Facilitator. The duration of this project was eight weeks.
Methods
Design Thinking Workshops
Process Mapping
Use Case Brainstorming
Interviewing
Surveying
Synthesis and Analysis
Data Flow Mapping
Deliverables
Use Case Prioritization Map
Research Plan
Interview Reports
Service Blueprint
Personas
Current State Journey Map
Systems Maps
Storyboards
Key Data Needs Map
Case Manager Data Needs Map
Survey Findings Report
Design Review Reports
Data Flow Diagram
Value Proposition
Process
Project Kick-Off 2. Understand the Current State 3. Envision a Future
Project Kick-Off
We engaged key stakeholders to discuss the problem to be solved, intended outcomes, and to define the project scope.
Project Kick-Off Workshop
To help stakeholders articulate who is using the data, why they are using it, and how they are using it, we led participants through a series of activities in a kick-off workshop.
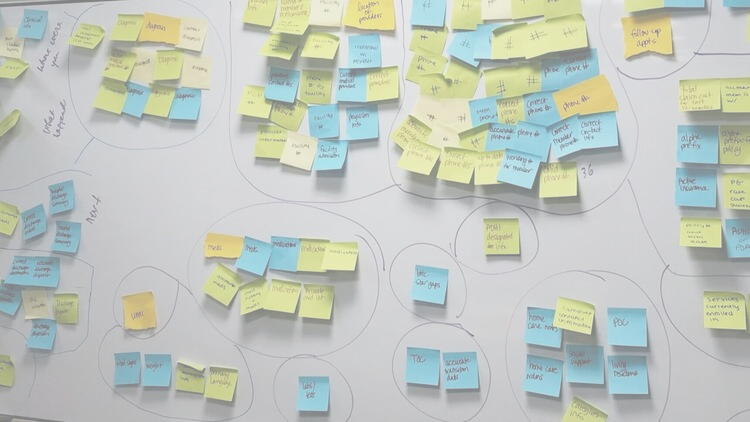
Use Case Canvas
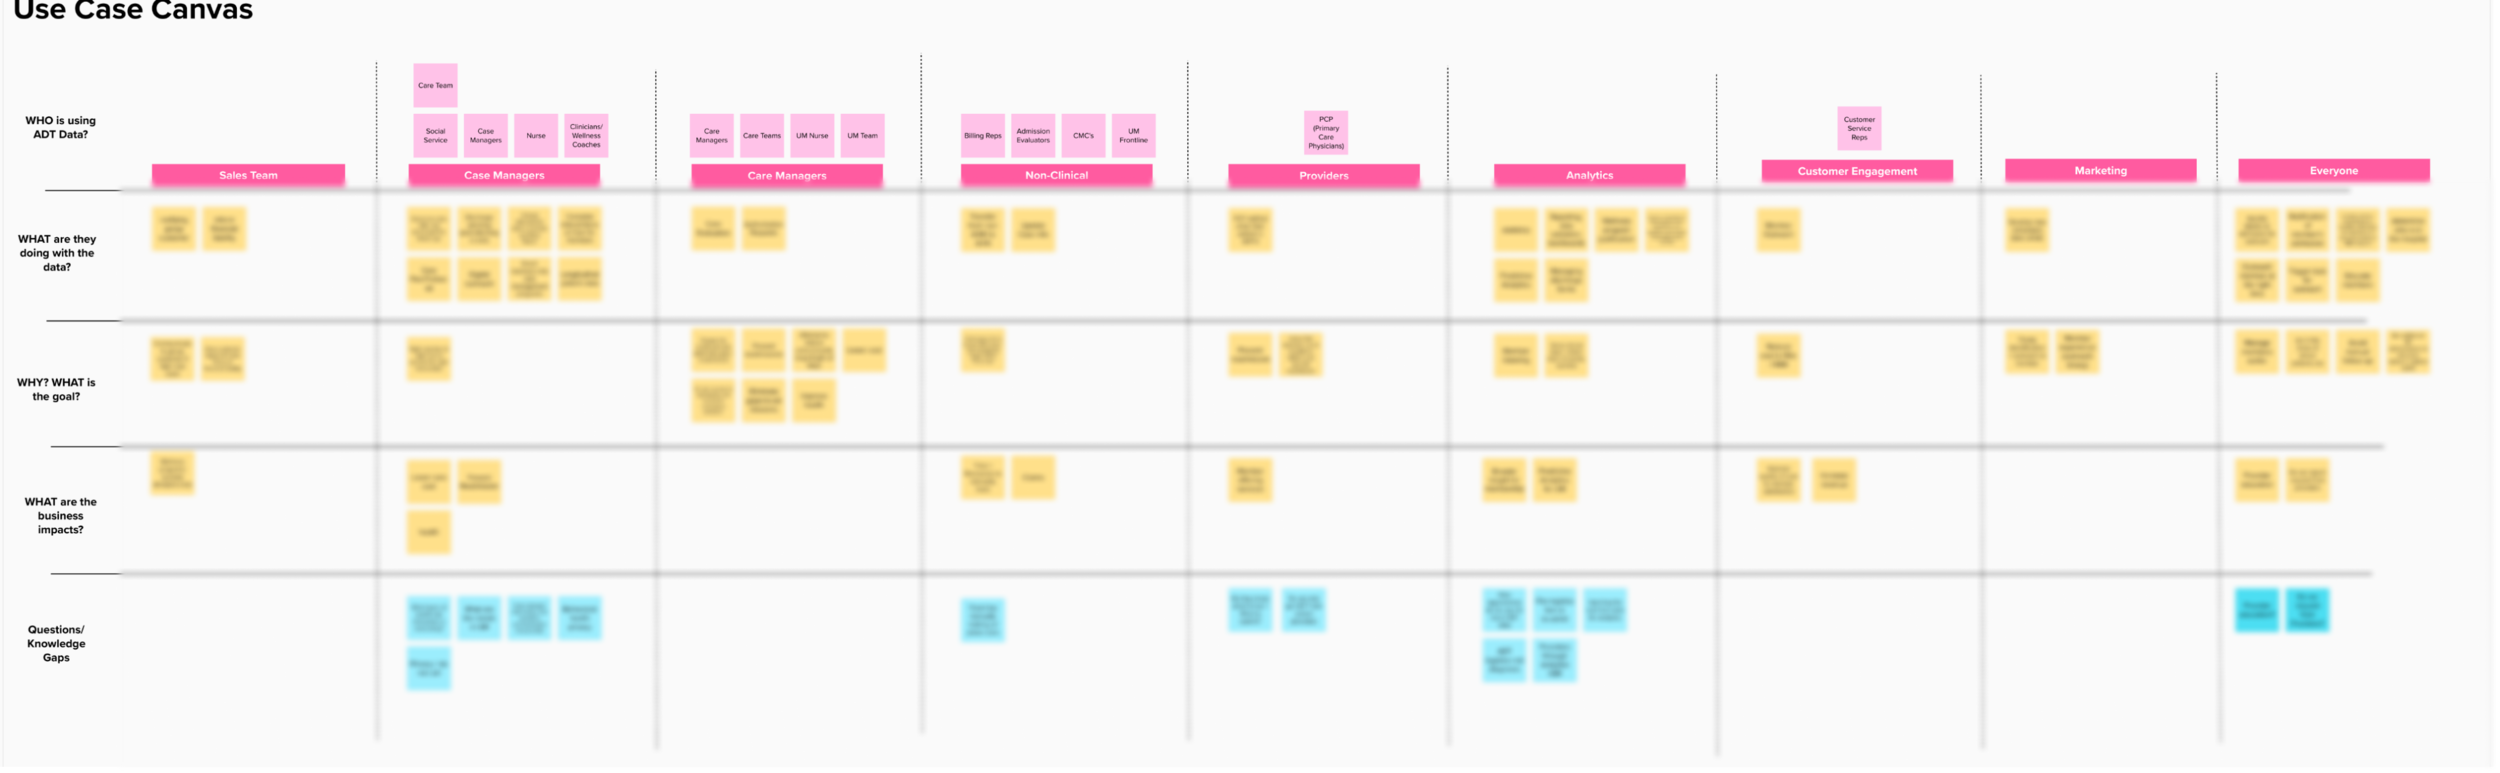
Use Case Canvas format used in our kick-off workshop to brainstorm who uses data and why. We worked in-person on the wall with good old fashioned sticky notes and markers and then digitized our work in Mural.
Through a use-case brainstorming activity, we helped stakeholders identify who uses the data, what they are doing with the data and to what end, as well as the broader business impacts. We used a canvas-like format and included space to identify any knowledge gaps or research questions as they arose.
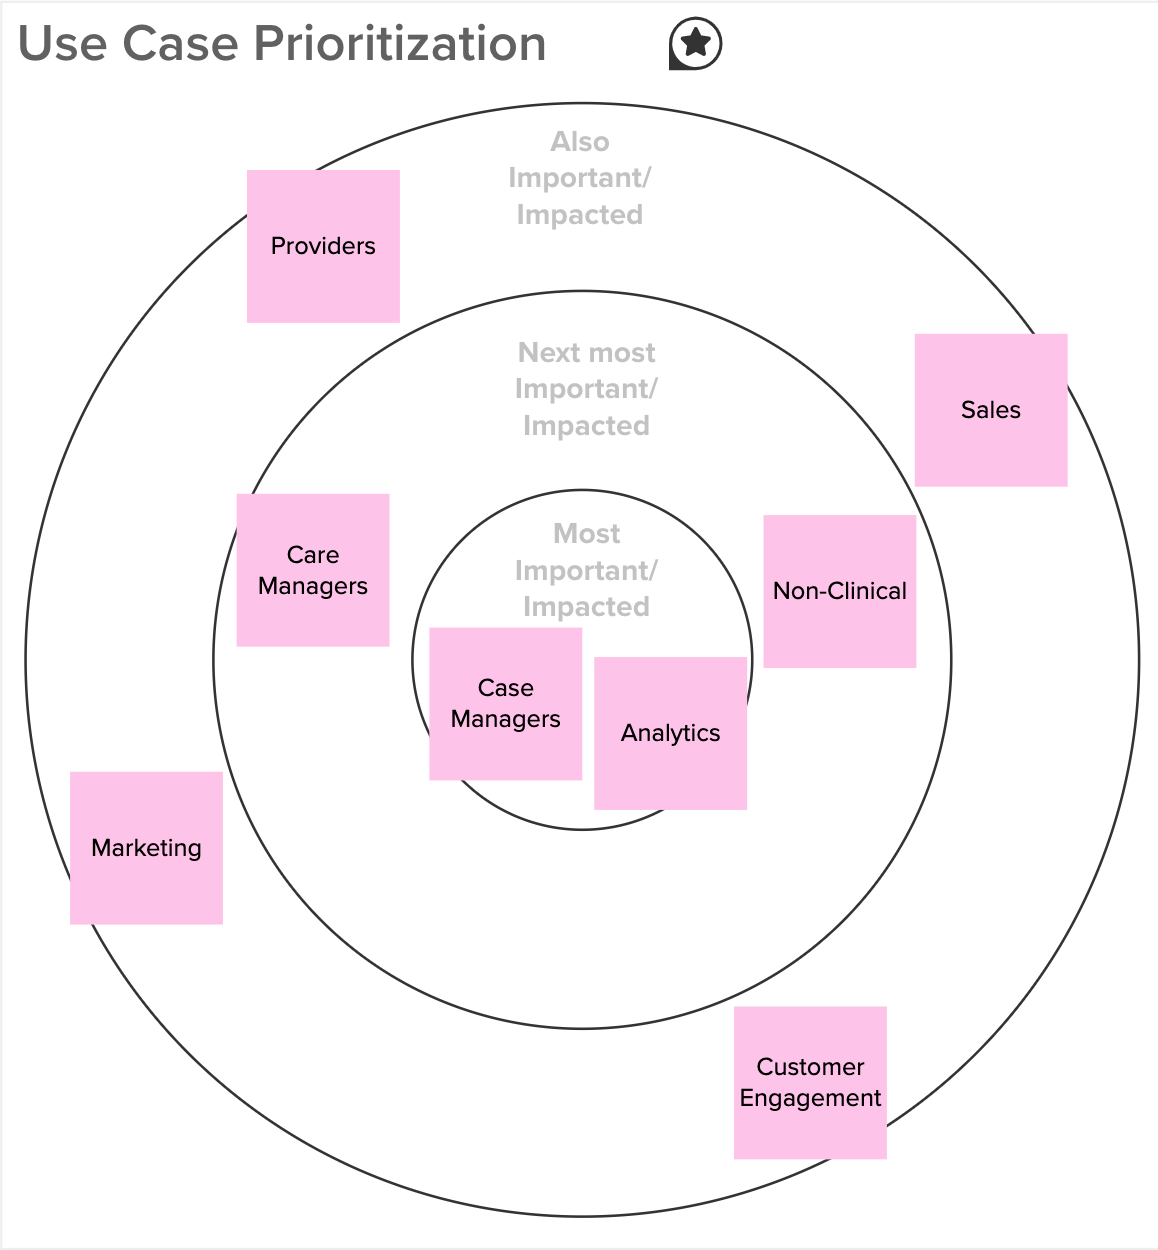
Use Case Prioritization
Once we had brainstormed all possible use cases, we used a bulls-eye format to capture the most impacted users as determined by stakeholders. Since it’s often difficult for stakeholders to declare that one user is more important than others, we used an impact scale from most to least impacted to ensure that every user was included.
Prioritizing users can be challenging when stakeholders have a deep sense of empathy and many business goals to consider. Plotting all impacted users on an inclusive scale helped participants clarify the degree to which everyone would be impacted.
Hypothetical Process Mapping
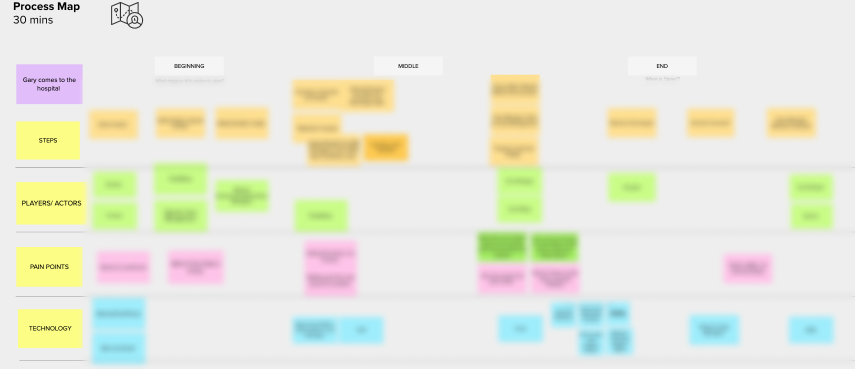
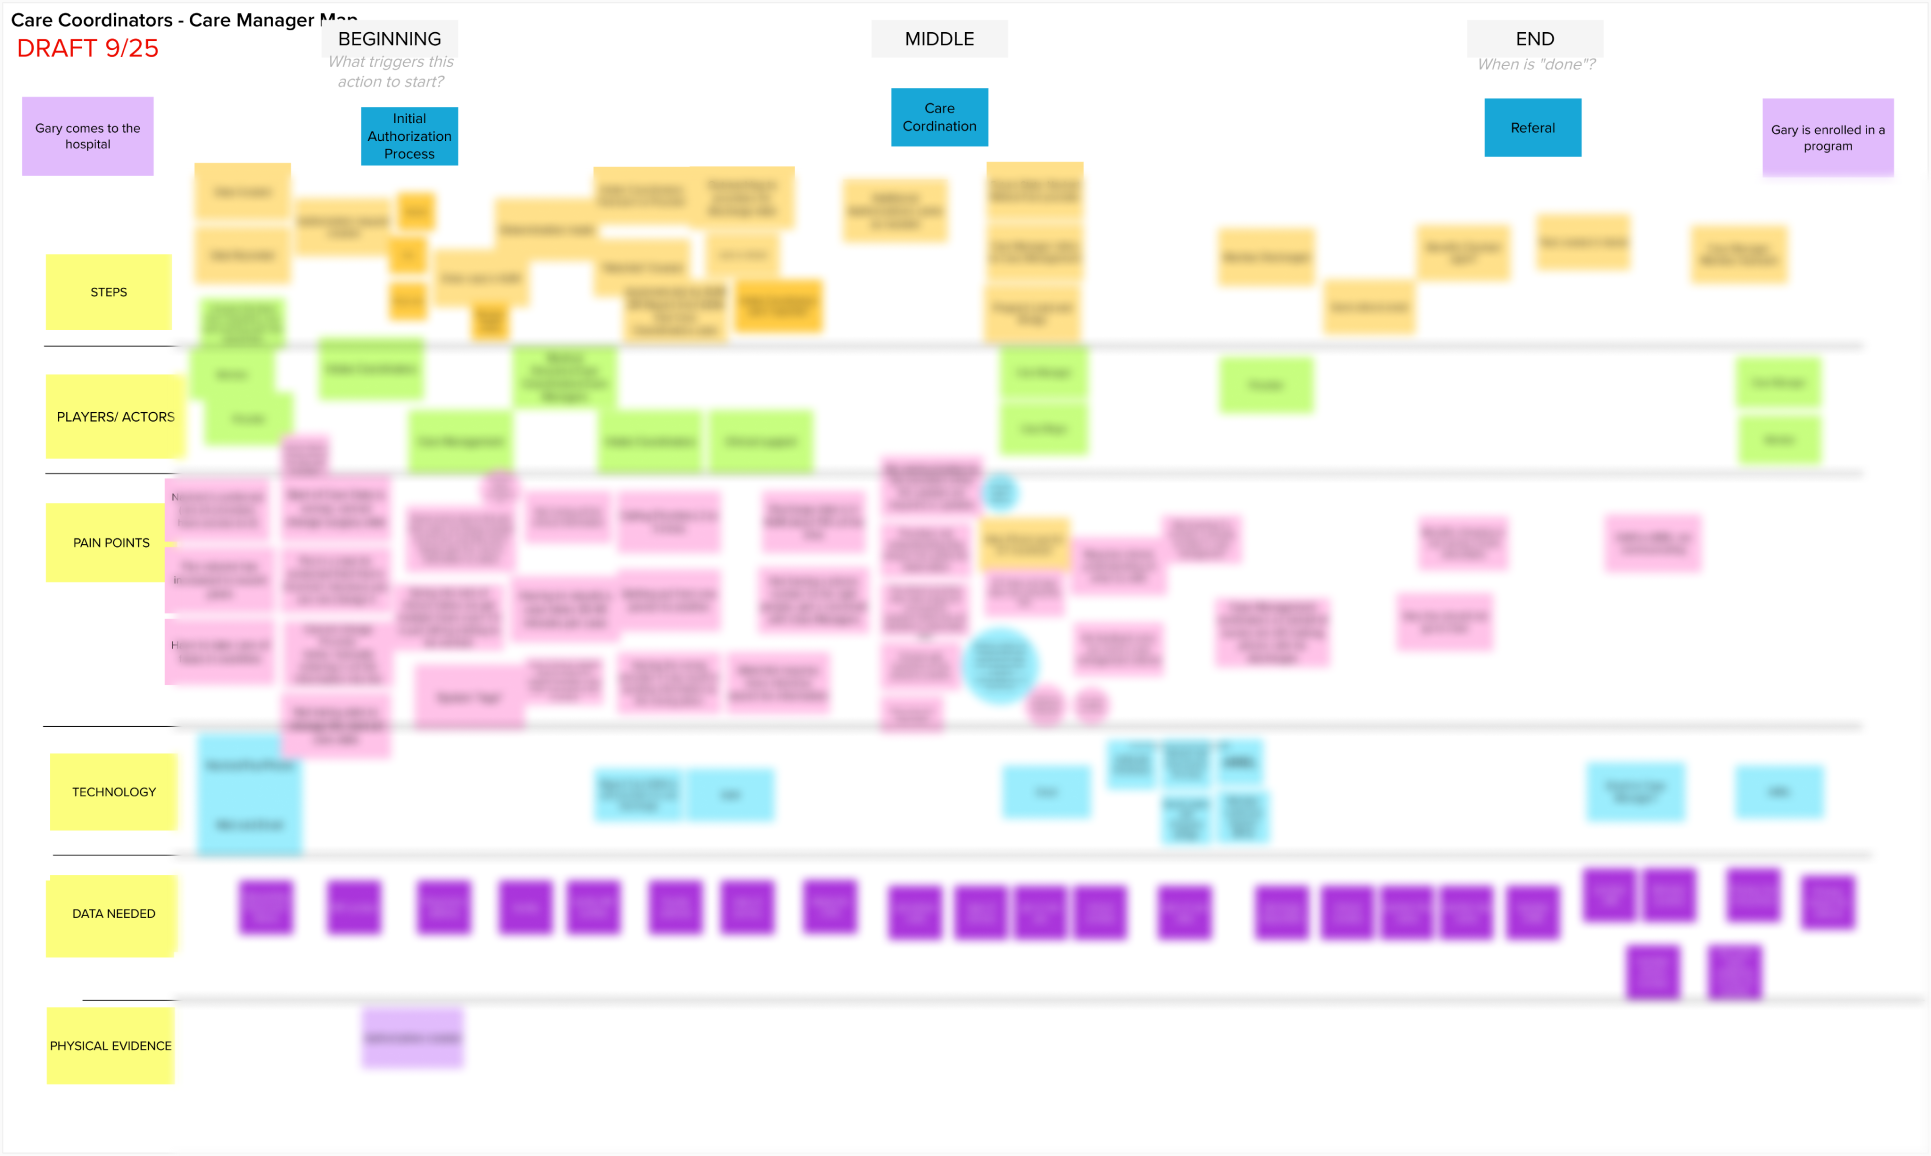
Similar to a traditional journey map, we used a simple process framework to sketch out the end-to-end process of case management. Generating this draft in the kick-off phase helped form our research goals.
After considering the impact levels of users, we led stakeholders through a process mapping activity in order to better understand how the data was being used and where problems occurred. Creating this draft map together gave us a starting point for our upcoming user research and helped us ensure alignment with all stakeholders.
Understand the Current State
To gain further clarity of the current state problem and validate user pain points, we conducted various research activities. As part of our analysis and synthesis, we created several visuals to communicate findings and insights.
User Interviews
We conducted nine one-hour remote interviews with users from three different user categories in order to better understand their needs and goals as they related to member outreach.
Key Findings:
Providers, clinical and non-clinical staff create cases for case management in an incohesive and inefficient service chain
To gain a member’s whole current clinical context, case managers must search multiple systems due to outdated data that’s gathered point-in-time
Case managers are unable to effectively outreach due to having incorrect contact and discharge information
Survey

In an online survey, we asked what information participants would want about the member in an ideal world and used affinity mapping to synthesize the responses.
We sent out a survey to users to gain quantitative insights for confirmation with a larger sample around the data case managers need and where the timeliness and quality are lacking most. We wanted to uncover the essential data case managers need for member outreach, as well as understand what data is often unclean and not accessible in the ideal timeframe.
We received 122 responses within a two-week timeframe. From the responses, we were able to define five essential member outreach data needs. These data needs represented the highest impact leverage points to providing more effective outreach.

Defining the essential data needed to conduct member outreach into five key elements helped the team stay on track and would enable future features to be implemented strategically.
Validation Sessions
To ensure we captured all the information correctly, we facilitated virtual validation sessions with users and subject matter experts. We used a virtual whiteboard to engage remote participants and correct our draft journey maps in real time.
Personas

From our research, we created composite personas such as for our key user, a case manager who is passionate about having a positive impact on members in their health journey.
Based on the insights we captured during our interviews, we created personas to be used as a tool to humanize research, problems, and pain points. They reminded us of who we were designing for and what their needs were as we worked with product owners to envision a future state.
Storyboarding
While the tools and systems that were built from this project immediately impacted the internal user, case managers, the end-user ultimately impacted in this case was the member. To align with the organization’s customer-first culture, we illustrated the case management process from the perspective of members and case managers in the form of a storyboard.

Drawing on the impact of story, this member-focused storyboard captured all stakeholders’ attention, providing the empathy to catalyze progress toward meaningful solutions everyone could get behind.
Service Ecosystem
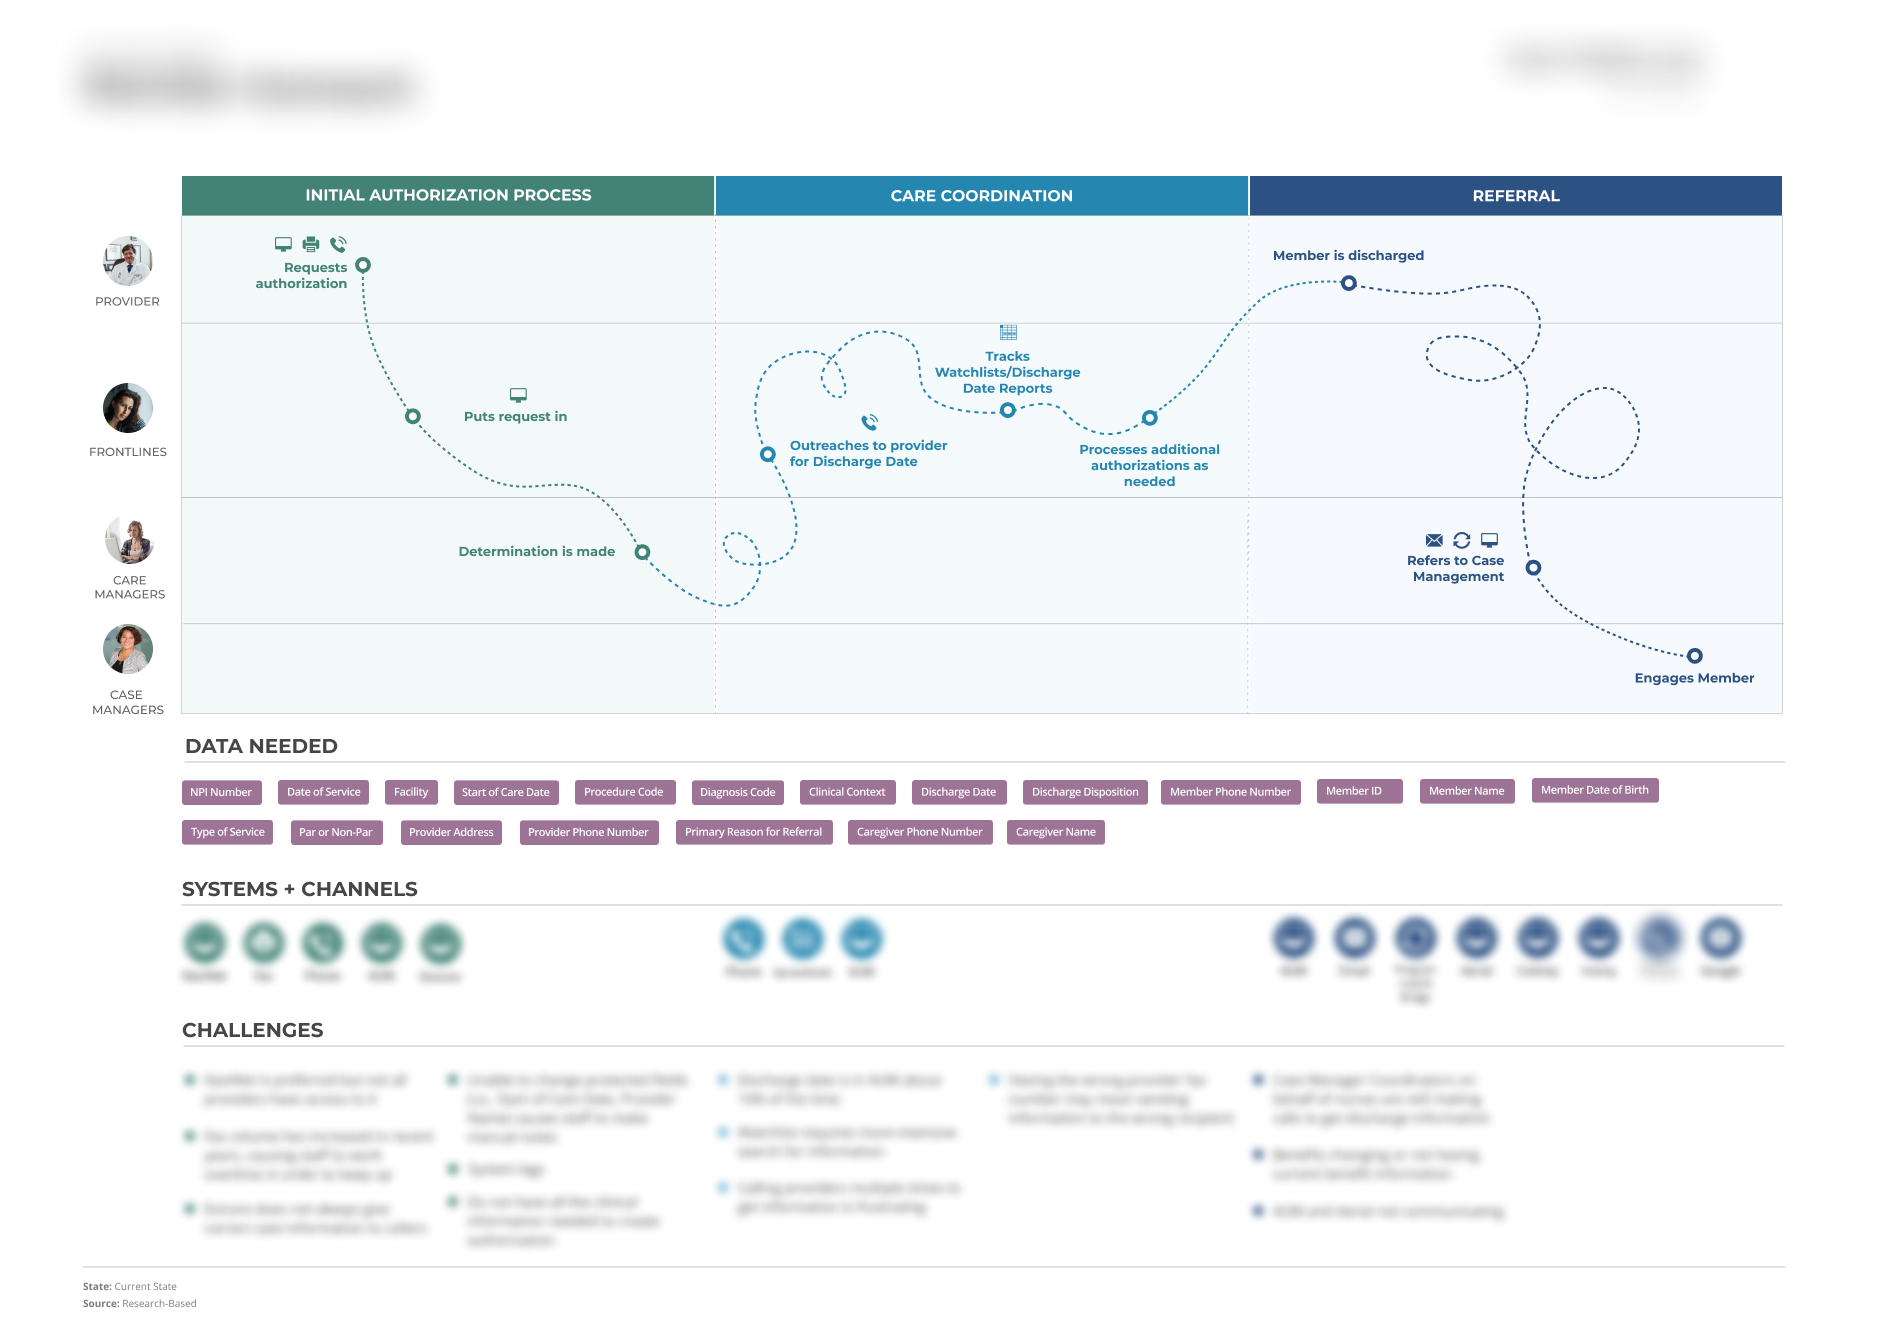
It’s often difficult to see the full picture, especially within a complex problem space. Framing the end-to-end process as a service and documenting key elements needed along the way helped make the situation more tangible.
In order to understand the full ecosystem to which case management belongs, we mapped the parts of member outreach that are particularly impacted by the timeliness of and access to data. This map, part service blueprint, part journey map, shows the end-to-end member outreach process from authorization submission to member engagement. Within each phase, steps are noted within each key player’s lane and systems, channels, and pain points are listed below.
Journey Map

Understanding the case manager’s journey was key to uncovering opportunities to bring in data more efficiently and provide more effective member interventions.
Using the insights we gained from the interviews and validation sessions we created a journey map of the steps that case managers take as well as the information they need in order to conduct member outreach. This journey map of our case manager “Barbara” is a tool to understand what case managers are thinking, feeling, and doing when outreaching to members and the information they are and are not getting.
Key Data Needs Map
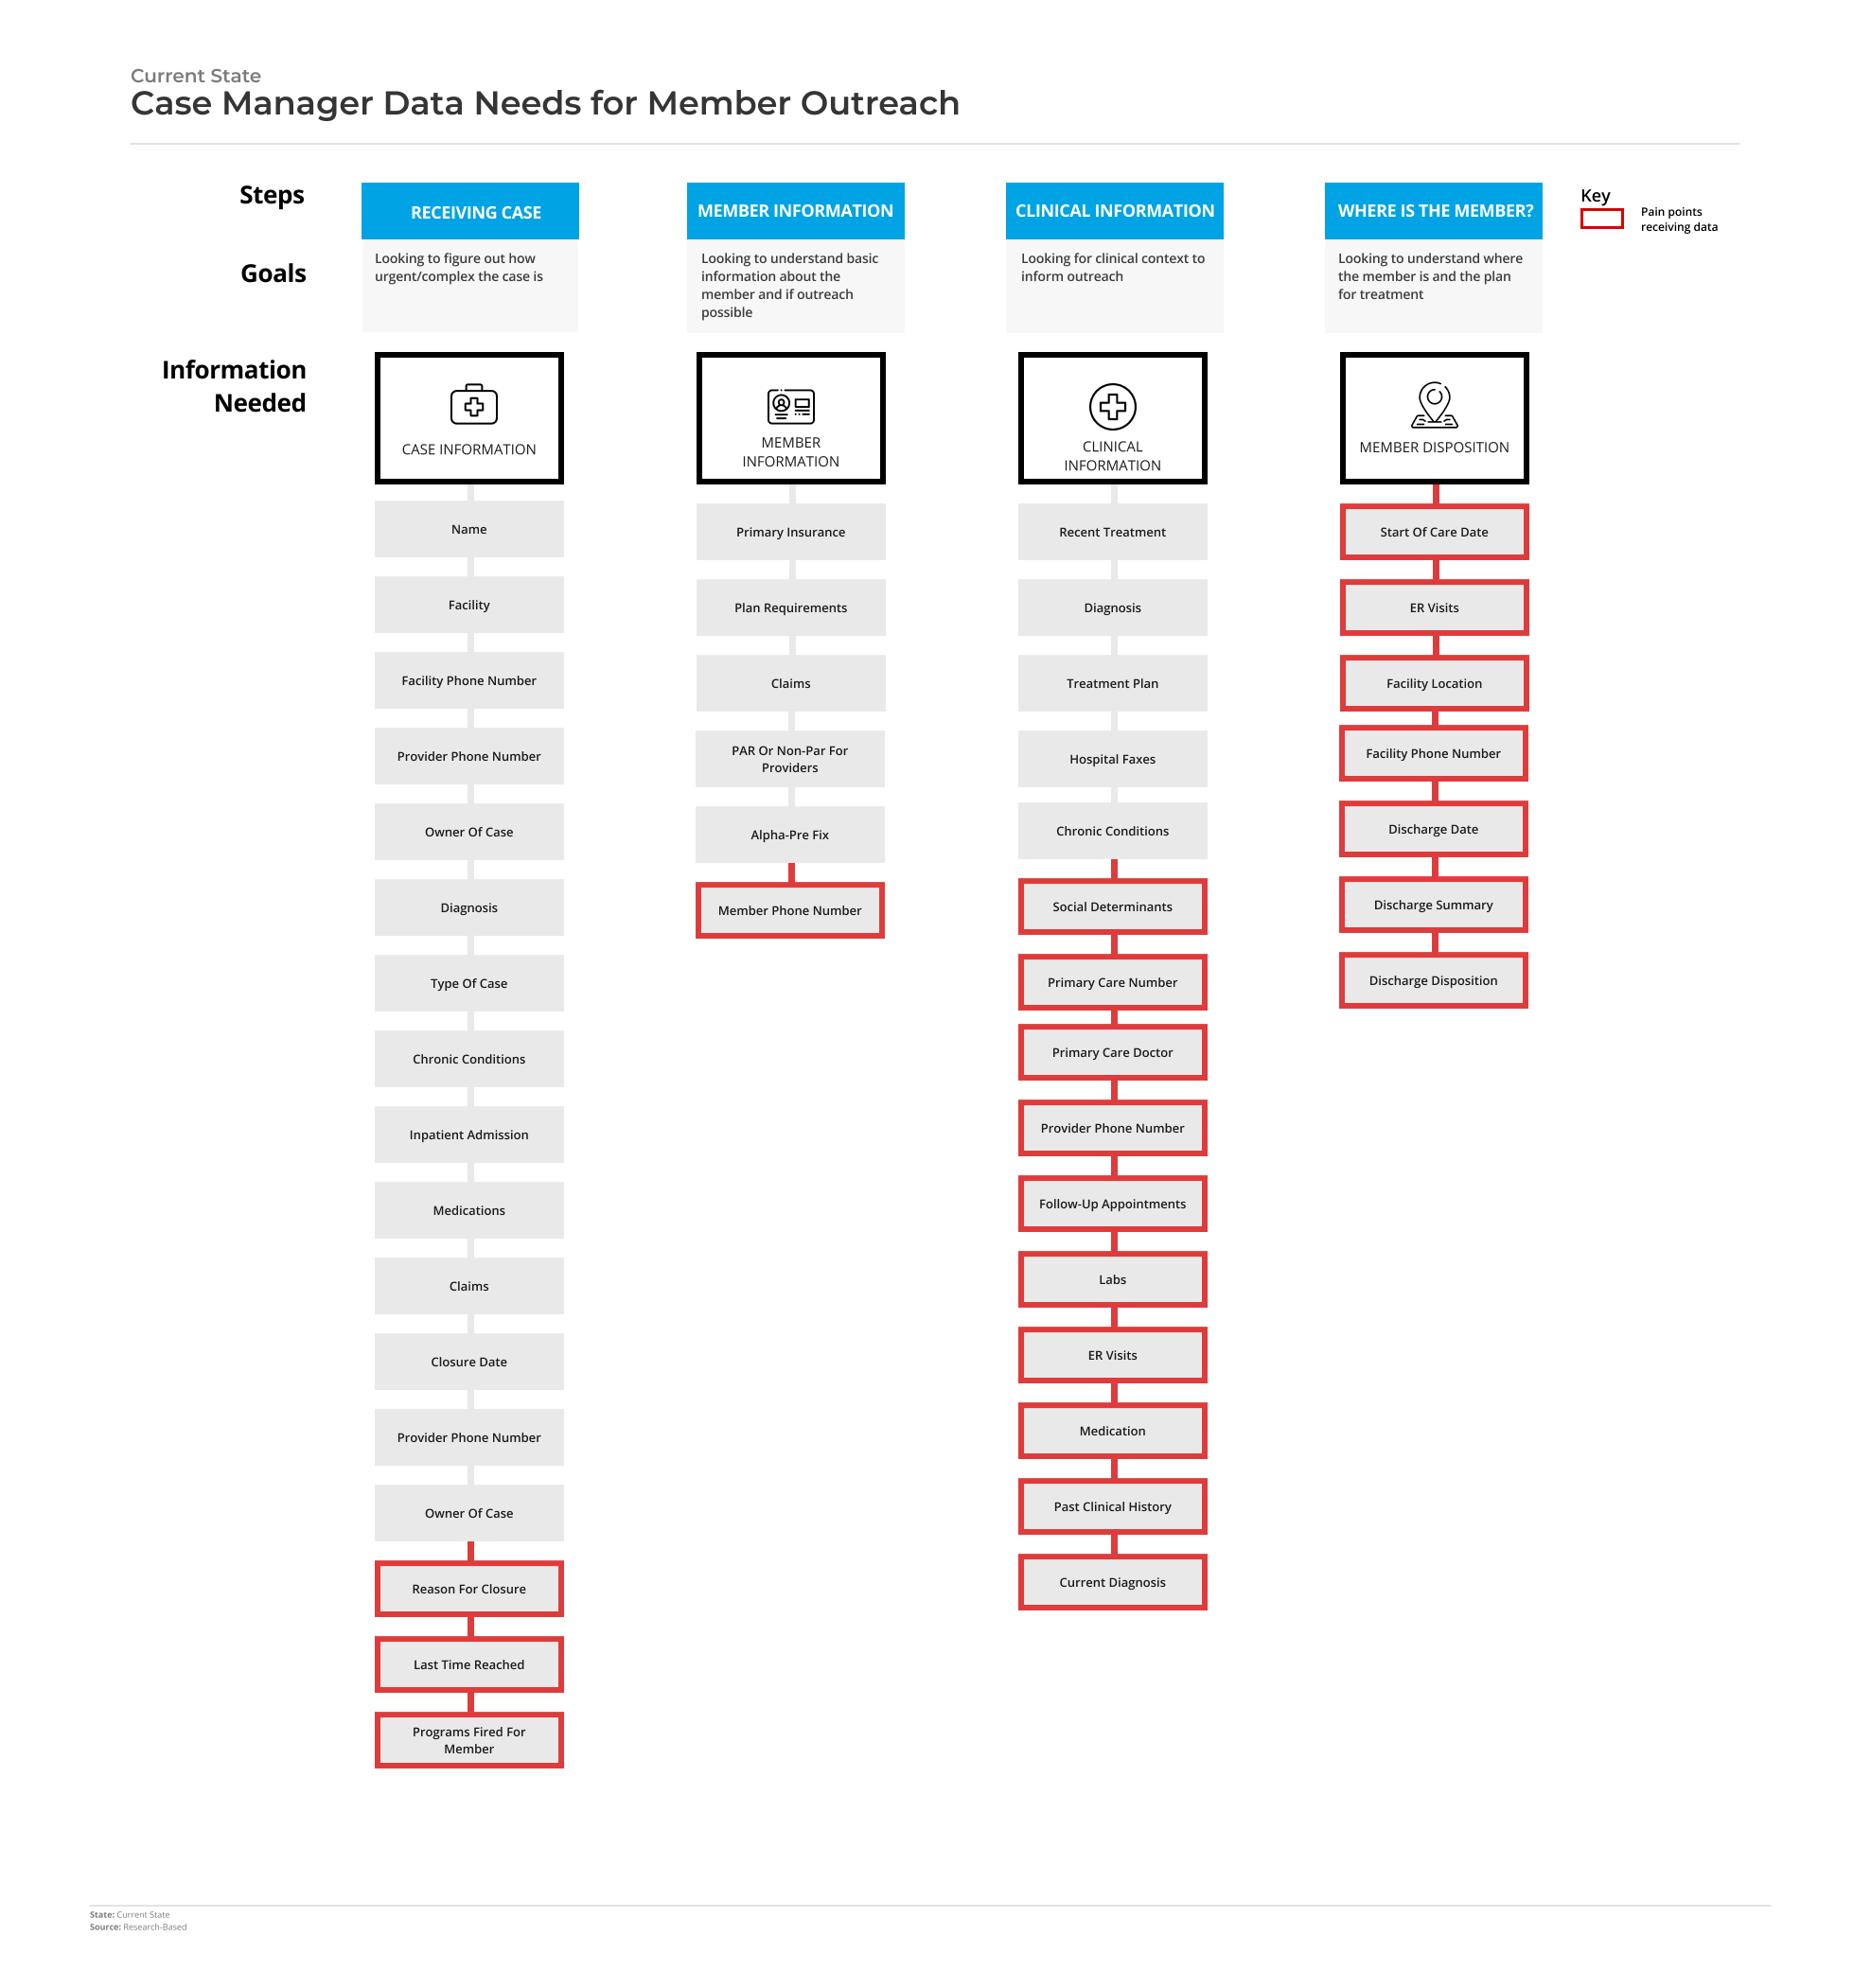
Defining data needed within the context of case management steps and goals helped us tell a story around the data. Much of the information that was missing or incorrect created significant barriers for case managers to do their jobs.
We created a visual that categorized key data elements within the context of the steps and goals to communicate the critical data needs we uncovered through our research. Highlighting the data associated with case managers’ pain points helped to illustrate the impact of the problem and define the data needs in a human way.
Systems Mapping
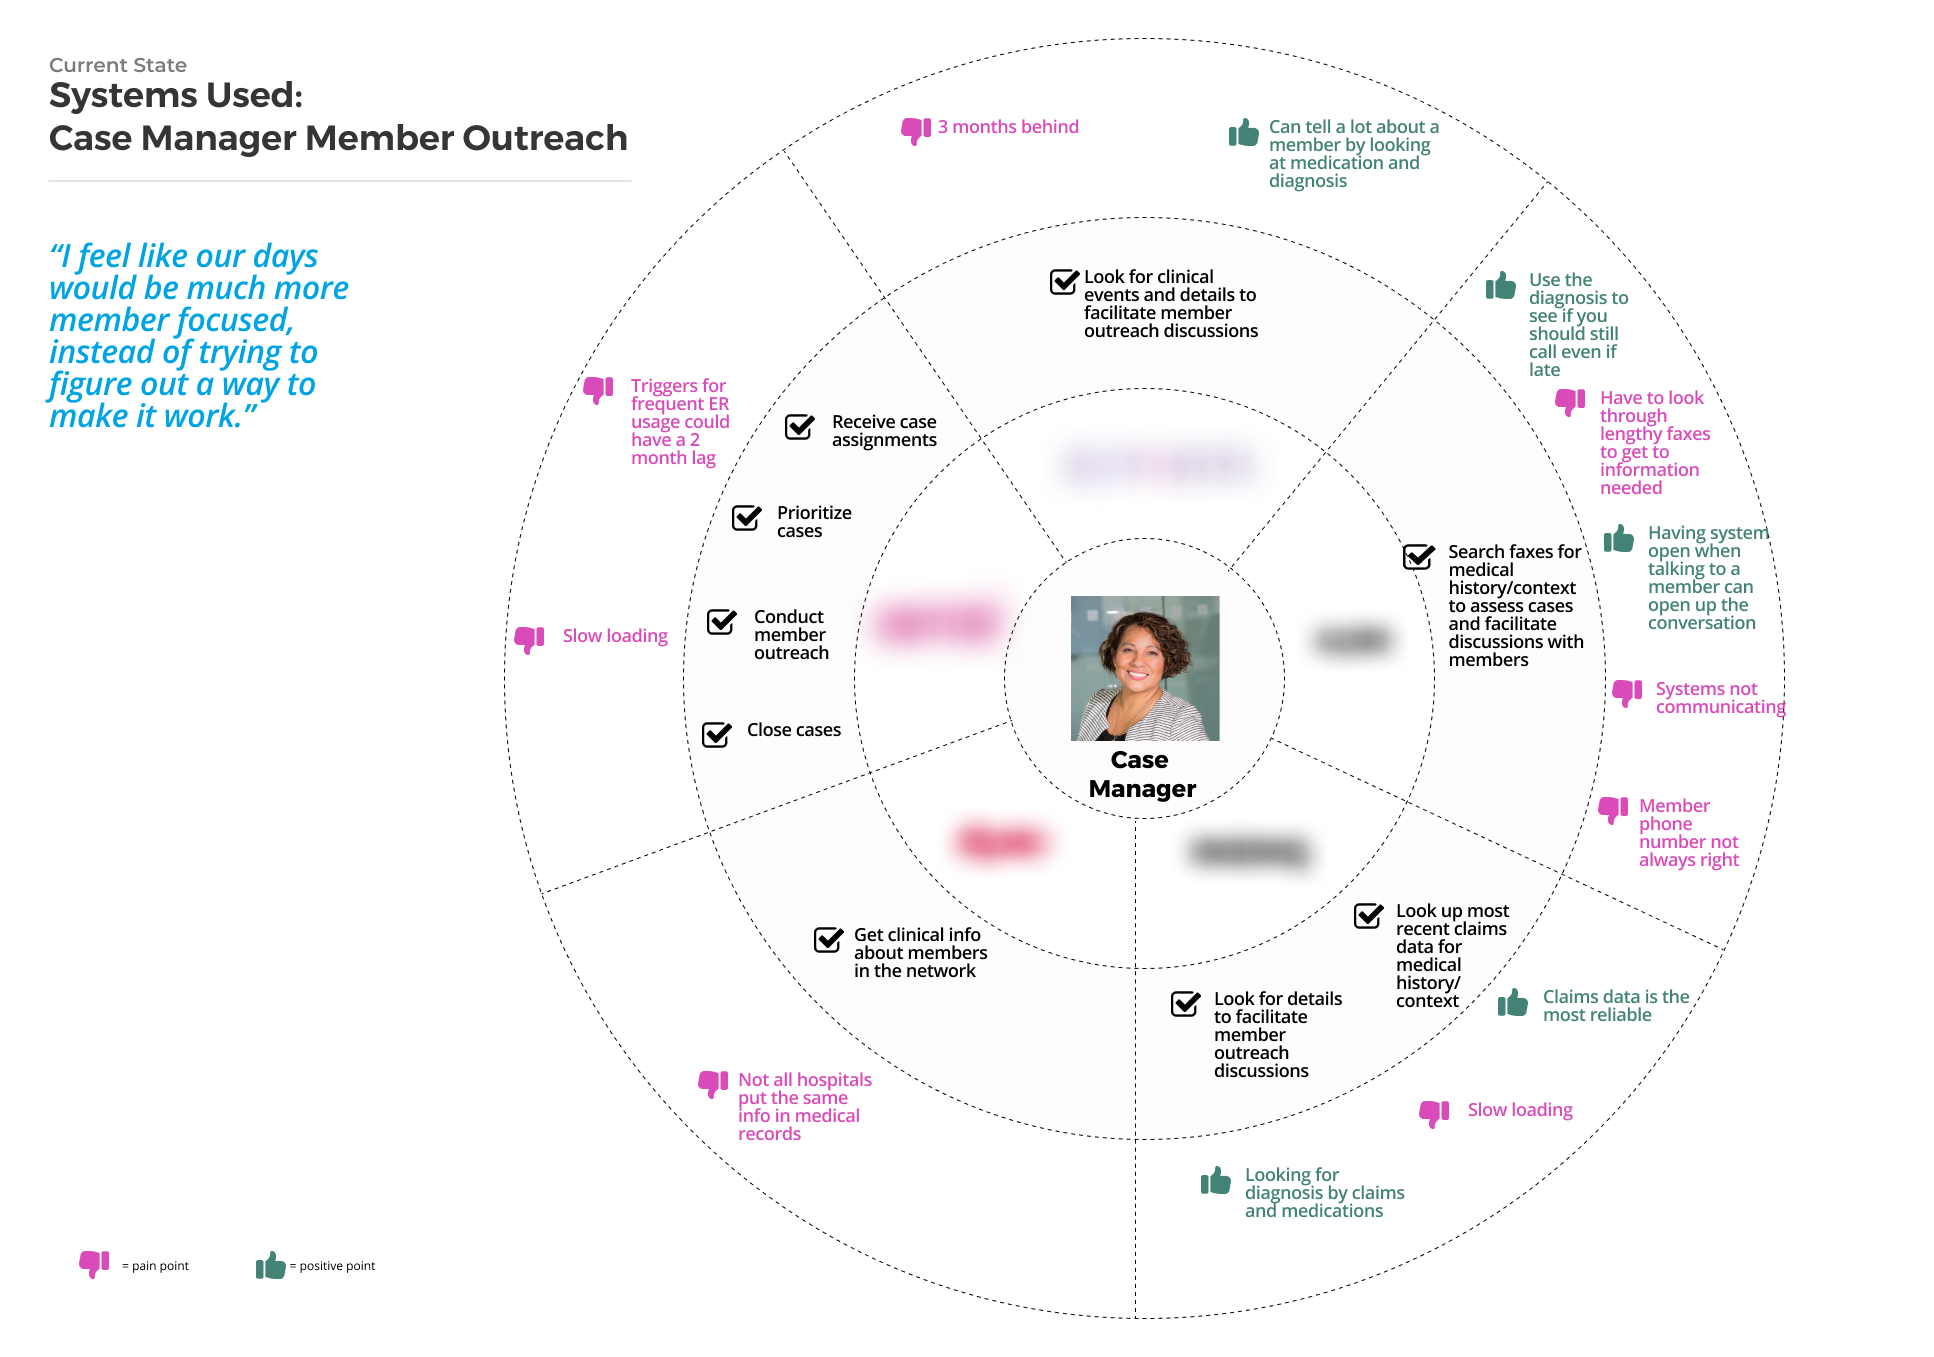
Bringing data in a timely manner would certainly alleviate many of the case managers’ pain points. We also needed a way to document the challenges around the tools that case managers used. For each persona, from the center outward, we mapped out the tools, jobs to be done, and pain/positive points with each.
Based on our interviews, we created maps to showcase what typical systems each of our personas have to go to for the individual task at hand. We found that not only did they need to go to multiple systems, but each system had unique challenges and frustrations that we wanted to communicate as areas of opportunity.
Envision a Future
In an effort to identify, prioritize, and build upon opportunities for improvement, we guided stakeholders in collaborative design thinking methods.
Design Thinking Sessions

Small groups filled out the Vision Statement Mad Lib worksheet and then voted on their favorite aspects from all.
We led stakeholders in a solutioning session during which we began a dialog about what the immediate future will look like. We designed the session to help key stakeholders understand how they will work together and to ensure all involved parties were on the same page. We captured topics and questions where more in-depth discussions were needed around key decision points.
Value Proposition
We led workshop participants through a value proposition mad-lib and voting activity which helped the group articulate the outcomes of the proposed solution.
Data Flow Map

Beginning with the key data needs, we mapped out how the data would flow and ultimately support case manager’s outreach efforts. Using a whiteboard to map out the group’s vision allowed the group to make changes as needed. We found that getting stakeholders to articulate the relationships between elements was key to this activity’s success.
Beginning with the five key data needs uncovered during discovery, we led participants through a collaborative, unstructured way of mapping systems where groups use visual thinking to show important actors, elements, and relationships. Through this activity, we were able to document a shared understanding of how data will flow through multiple systems and people. The resulting data flow map could be used by data architects to implement the underlying data and infrastructure foundations.
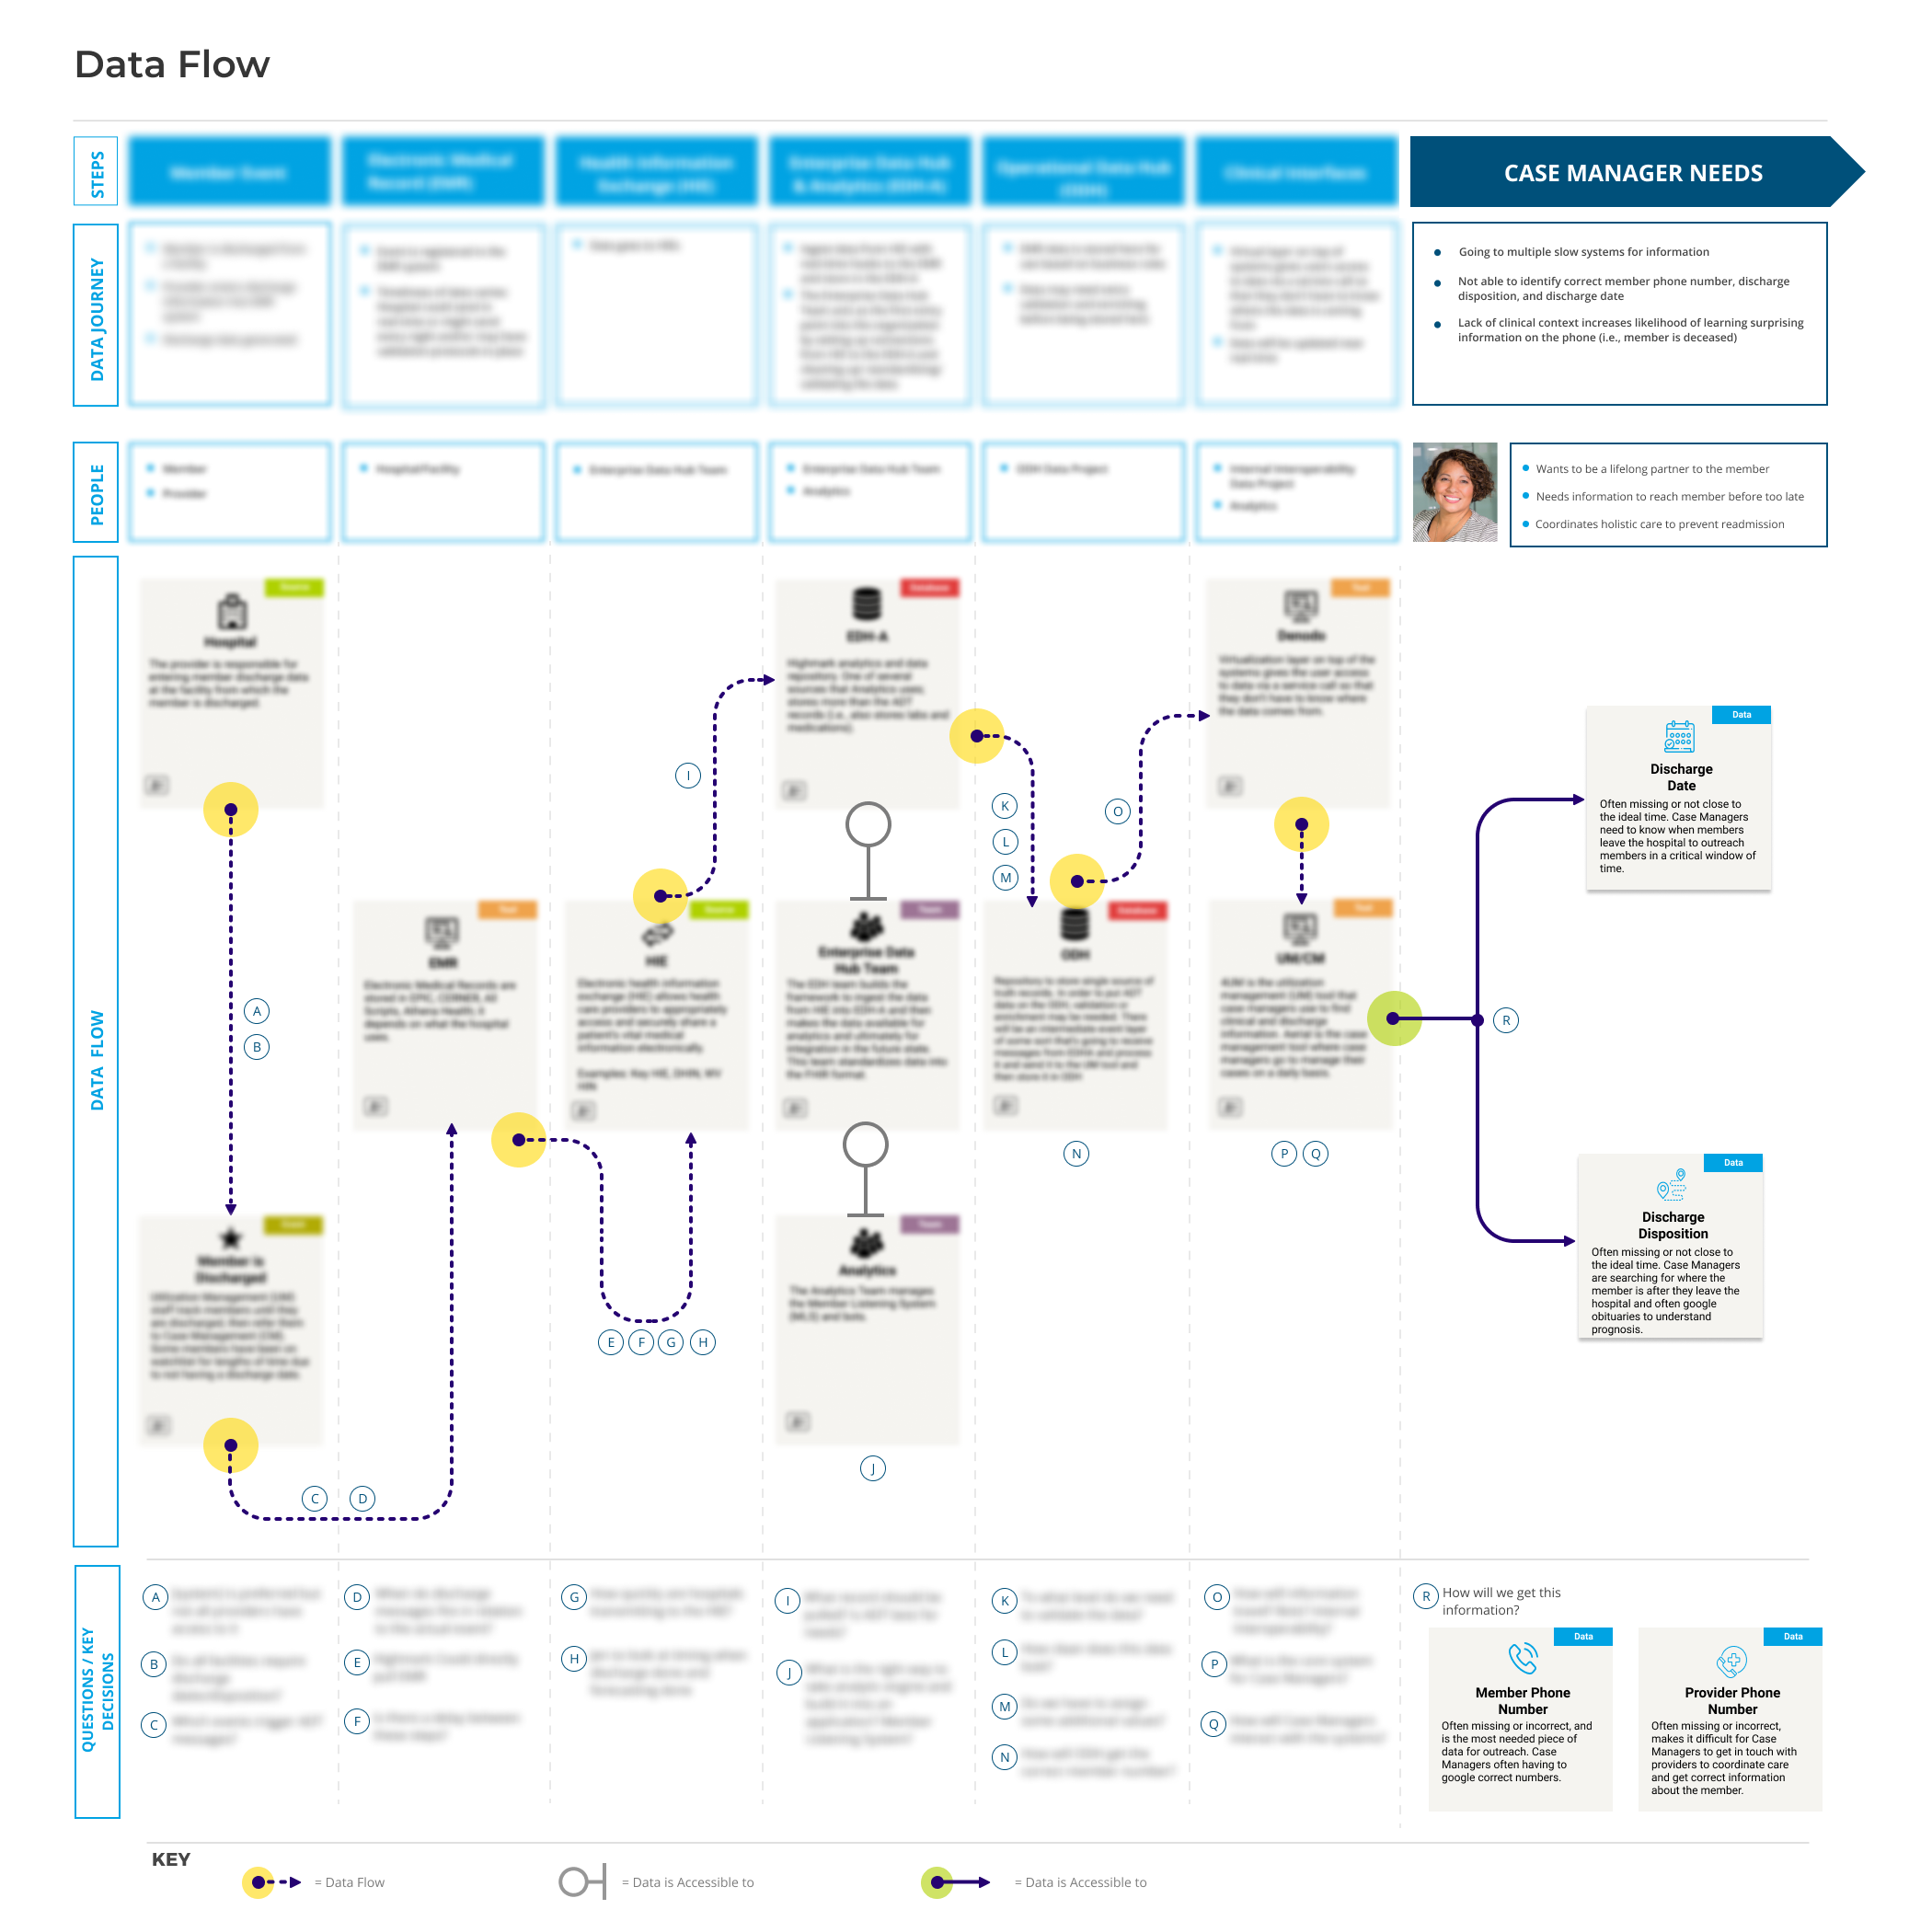
As a final deliverable, this data flow map infused a human-centered lens by highlighting case managers’ needs. For each element within the data flow, we created a card with a short description and noted key stakeholders responsible.
Final Thoughts
Cultivating a sense of curiosity on our team enabled us to uncover meaningful insights to which everyone could relate and ultimately catalyzed this project’s success. Our team kept an open mind allowing us to protect and value the time needed to conduct user research. As designers, we learned to accept data and technical issues as part of the problem space. Above all, we embraced a collaborative spirit by co-creating with folks across disciplines. As the final outcomes of this effort continue to evolve, we know that the human-centered insights gained and newfound working communities will inform future value-based outcomes.

Interested in learning more about designing with data? Check out this article written by my colleague, Jaime Goff and me!